
What it connects
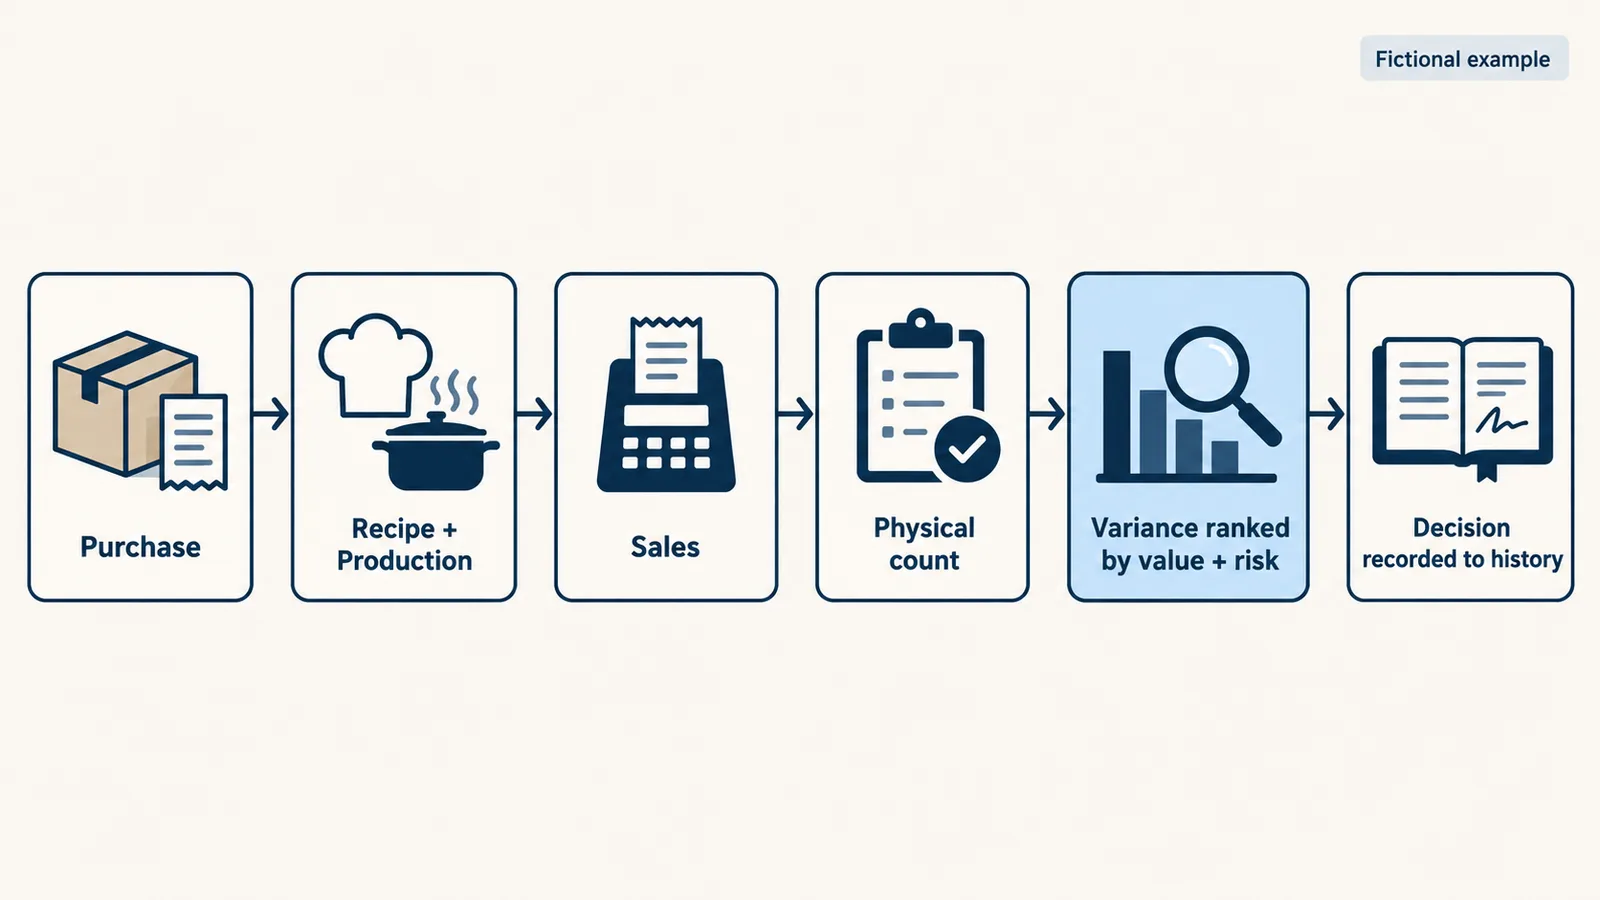
Variances are ranked by value and risk, with source preserved.
Lots and locations
Track the same ingredient by lot and storage location, so receiving, production and counts stay comparable. Example with fictional data: 20 kg of chicken received in Lot A split between cold room and line; the count shows 14.2 kg remaining where recipes and sales predicted 16.1 kg, so Wobistro flags the 1.9 kg gap by location for review.
Classified waste
Record waste by cause — prep trim, overcook, spoilage, breakage — instead of one total loss. Example with fictional data: of 2.4 kg flagged waste this week, 1.5 kg is labeled prep trim and 0.9 kg spoilage in one cooler, so the shift reviews ordering and rotation first, not the whole menu.
How it works
Wobistro preserves the source, identifies the exception, prepares an action within permissions, and records the responsible person's decision. Every result returns to the history so the next shift starts with context.
Try this flow with fictional data.
Use the demo with fictional data to walk purchase → recipe → sale → count on one high-value ingredient. No real customer data needed.
Demo uses fictional data.
Templates for starting with clean data | Hospitality operations glossary
Reviewed